
Editor’s note: We’ve partnered with the National Consortium for the Study of Terrorism and Responses to Terrorism (START) to publish a series of infographics based on data from their Global Terrorism Database and related START projects. Each week we’ll release a new set of graphics that depict trends in global terrorism activity. Sign up for the War on the Rocks newsletter to make sure you don’t miss any of them!
Terrorism’s footprint is truly global. In 2013, according to data collected by START, incidents of terrorism were recorded in 94 countries around the world. But the threat is far from uniform. The map below depicts the intensity and concentration of terrorist violence in 2013. We’ll follow up on this global picture with new infographic sets each week that examine some of the most interesting current and historical trends in terrorist activity. (Click on the image to expand it).
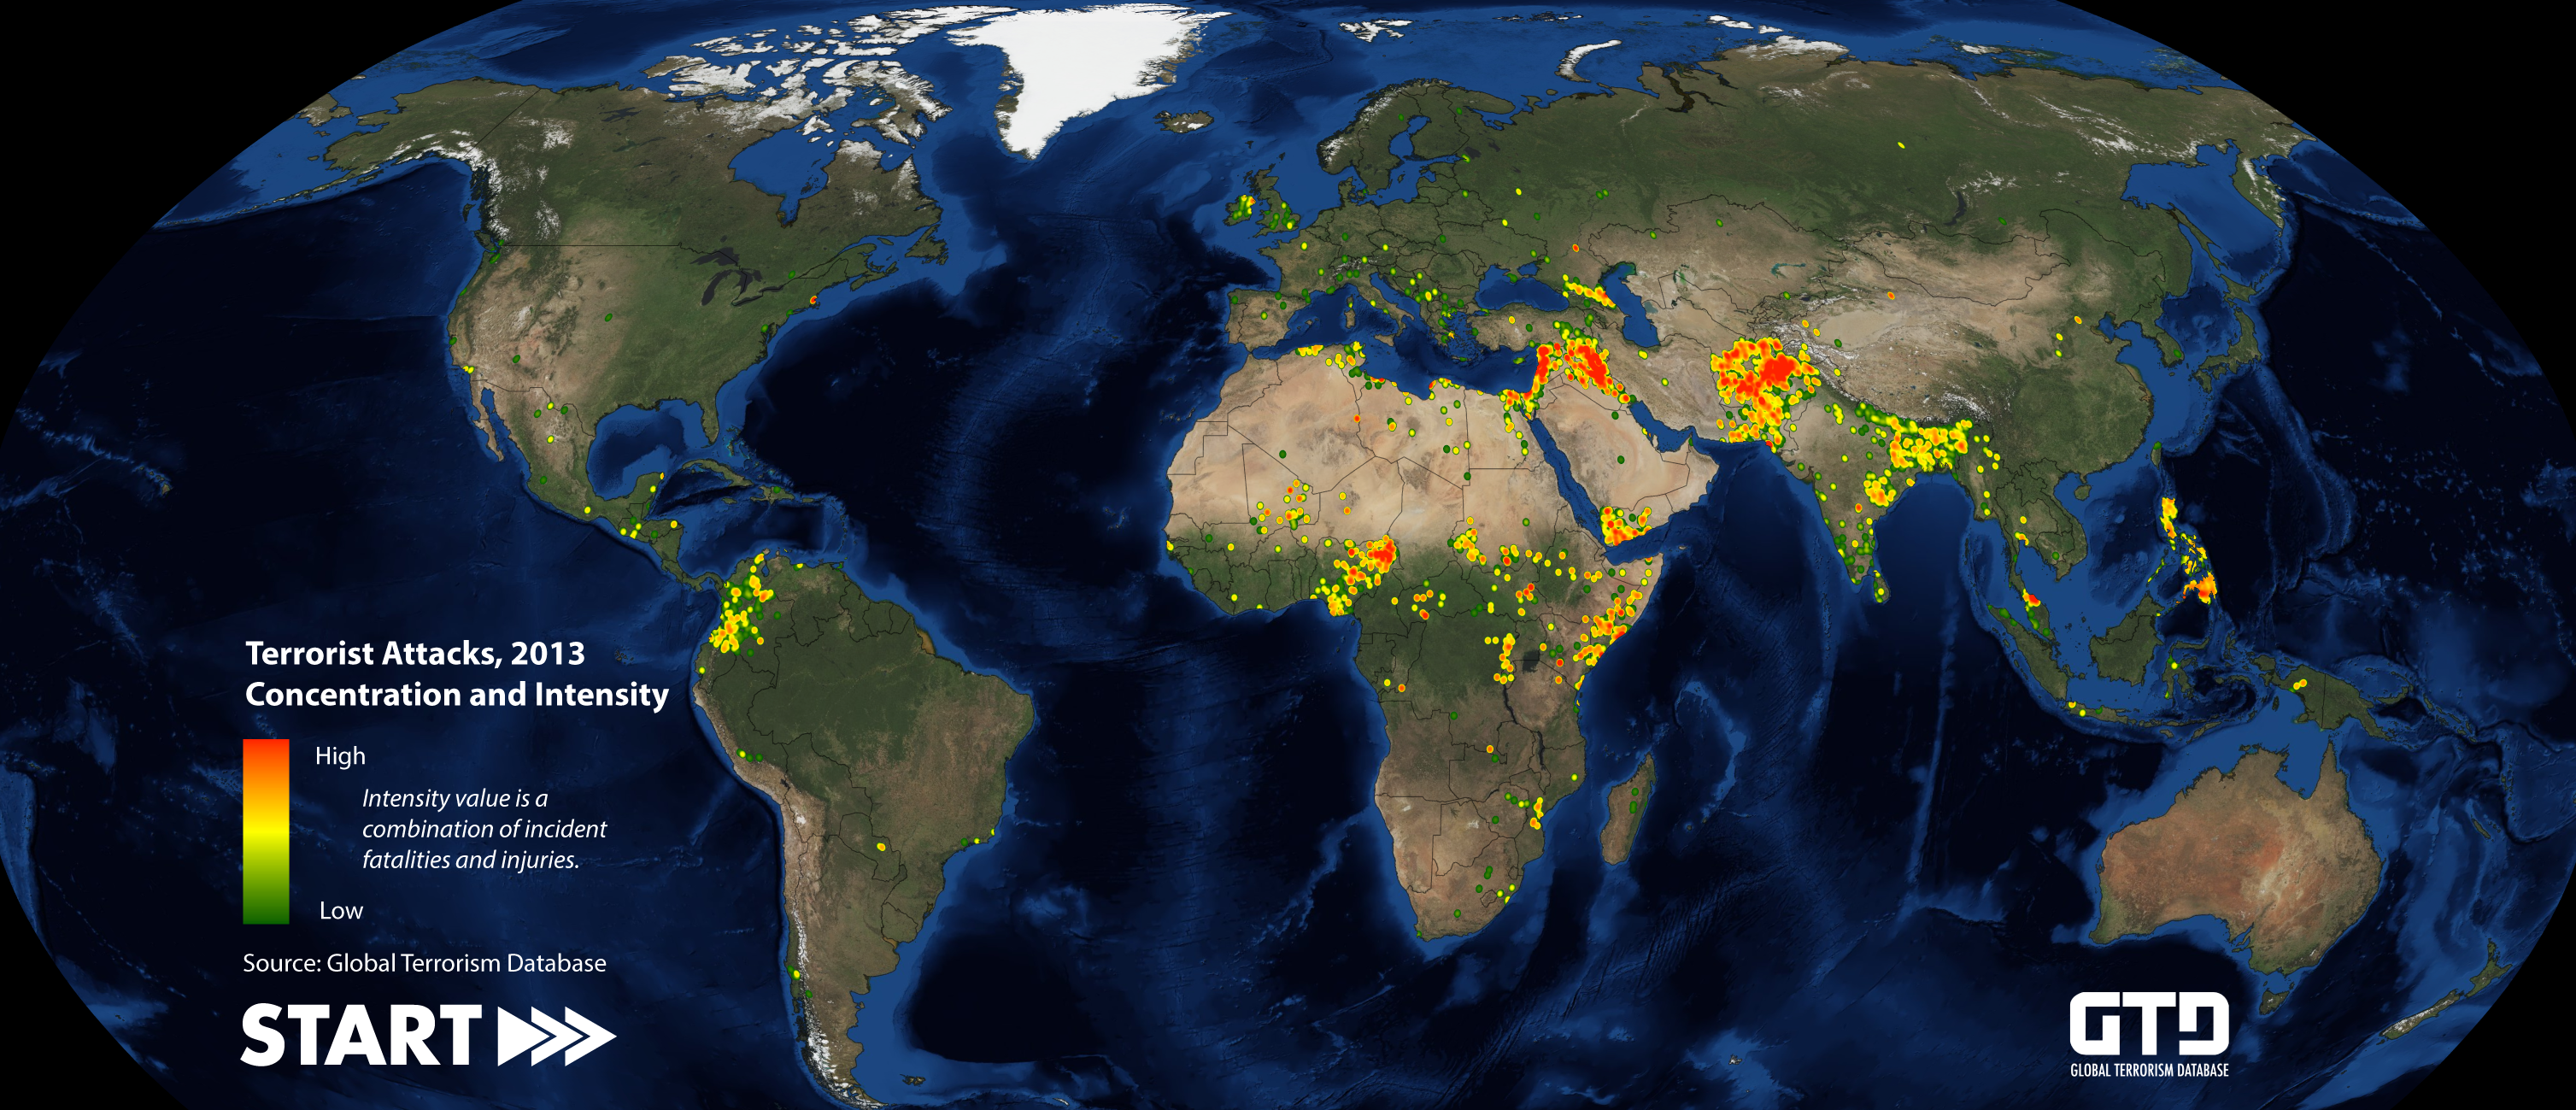
Graphic designed by William Kammerer, START.
**Note: This graphic is based on preliminary data that is subject to change. 2013 GTD data is not yet available for public download or distribution. It will be released via the GTD website later this summer.
Photo credit: Anne Knight (adapted by War on the Rocks)
read more:
http://warontherocks.com/2014/06/infographic-where-terrorists-attacked-in-2013/
Related articles
- 2013 global DDoS attack trends infographic (prolexic.com)
- Regional body to establish anti-terror unit (glblgeopolitics.wordpress.com)
- US Intel Knew in Real Time Benghazi Attack was Terrorism from Intercepted Phone Calls (counterjihadreport.com)
- Examining Trends in the Global App Economy [Infographic] (mefminute.com)
- The Internet in Real Time [LIVE INFOGRAPHIC] (socialmediatoday.com)
- How Terrorists Use Social Media: A Timeline (wilsoncommonslab.org)
- ISIS “too extreme for al-Qaeda” (presstv.com)
- The Father and Mother of Terror (danielmabsout.wordpress.com)
